


Photo Credit: El Nariz / Shutterstock
One of the COVID-19 pandemic’s most significant long-term effects on the economy could be rising wages. With widespread shortages in the labor market reported this summer, many employers—particularly those with lower-wage employees—have tried to entice workers with improved compensation and benefits. These trends have led to the fastest rates of wage growth since the Great Recession, especially among the lowest earners.
But lower-wage professions still have a long way to go to match the strong rates of wage growth for higher-income jobs over the last few decades. According to data from the Economic Policy Institute, inflation-adjusted wage growth from 1979 to 2019 for a worker at the 10th percentile of wages was a mere 3.3%. For the median earner, wages grew 15.1% over that span, while for 95th percentile earners, wages were up 63.2%.
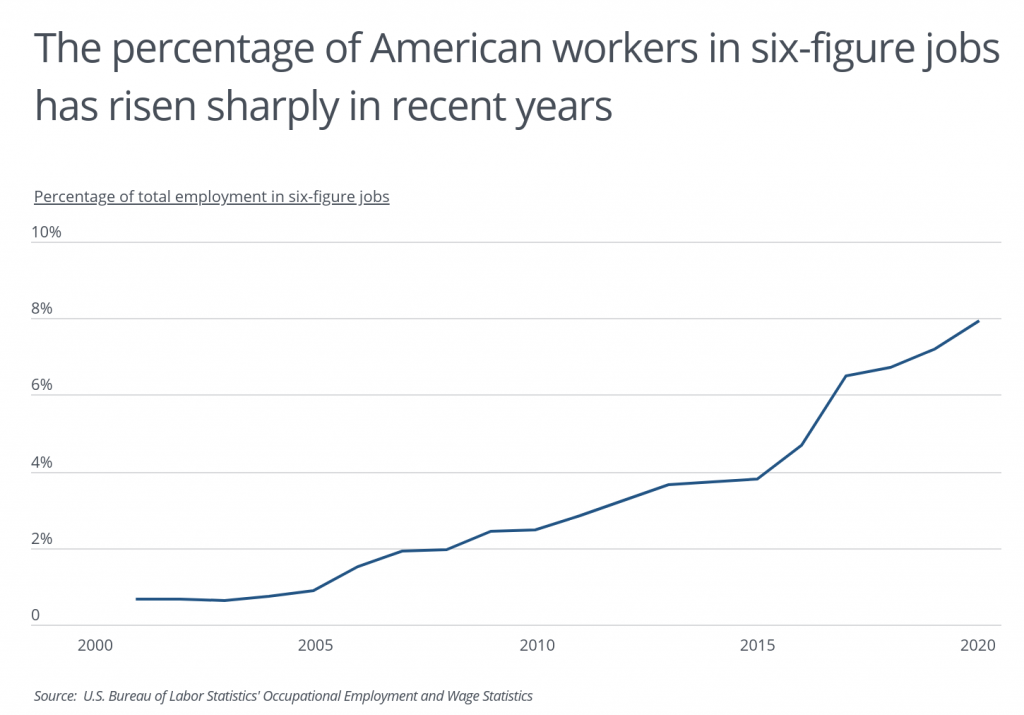
These divergent trends have driven up the share of Americans in high-earning professions and created larger gaps between higher and lower ends of the income spectrum. Twenty years ago, only 0.7% of American workers were in jobs that typically paid more than $100,000 per year. By 2015, that share was 3.8%. And in the last five years alone, the percentage of American workers in six-figure jobs more than doubled to 7.9% in 2020.
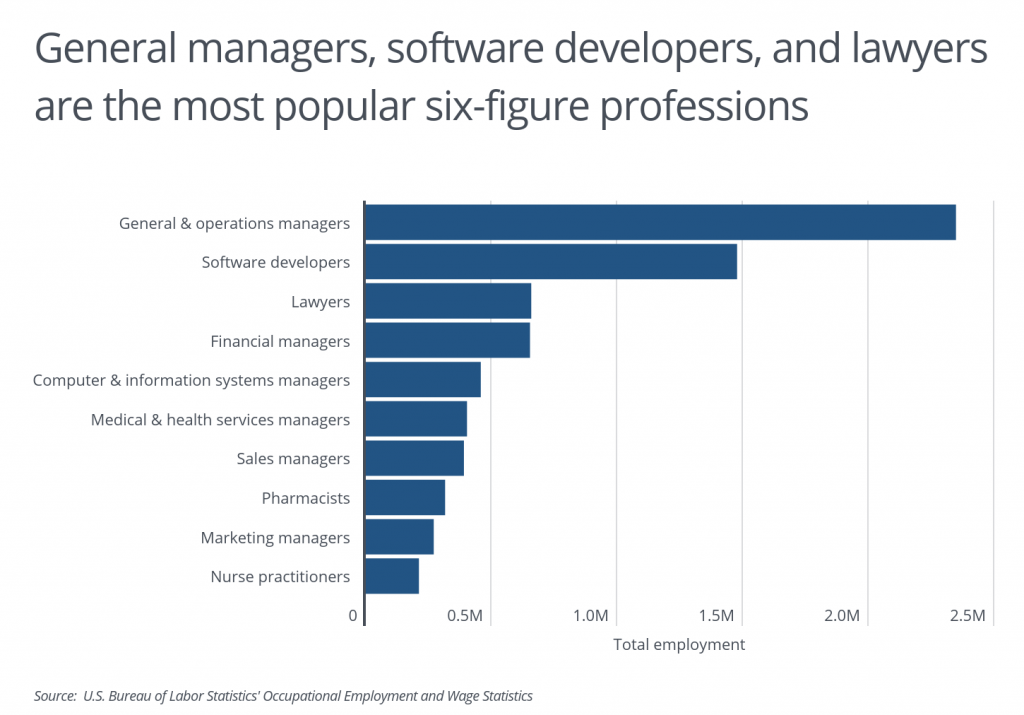
One field that may be contributing to the growth rate of high-paying jobs nationwide is tech: software developers and computer and information systems managers—both of which have faster growth rates than most other professions—currently combine for more than 1.9 million high-paying jobs. But while fast-growing tech jobs and more specialized fields like law, health, or finance often get the attention, the most common six-figure profession is general and operations managers. More than 2.3 million U.S. workers fill this role, which is common in organizations of all types across the public and private sector, and it has a median annual income of $103,650.
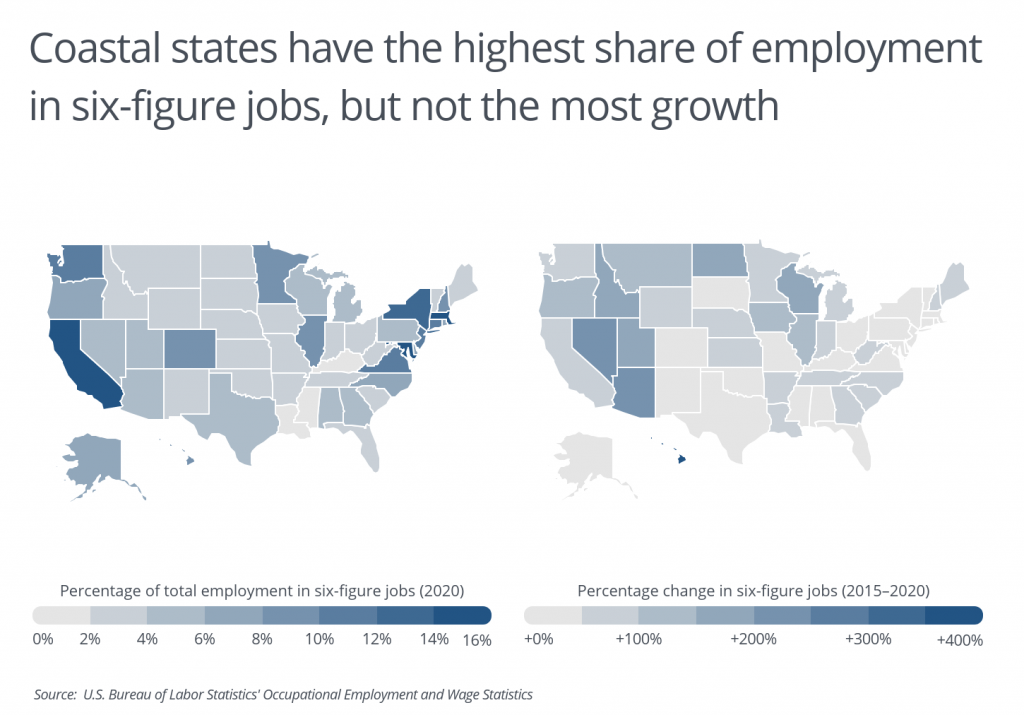
In addition to being concentrated in certain fields, high-paying jobs are also geographically concentrated. Six-figure salaries are most common in coastal states including California, Massachusetts, Maryland, and New York, where the population tends to have greater educational attainment, cost of living is higher, and high-paying industries like tech, business, law, and health and life sciences are more prevalent. But even many parts of the country where these jobs are less common are seeing growth. Six-figure jobs more than tripled in Hawaii from 2015 to 2020, and ten other states—mostly in the Mountain West and upper Midwest—had a growth rate for six-figure jobs of more than 100% over the same span. Many of these states are proving more attractive to employers and professionals seeking lower-cost locales.
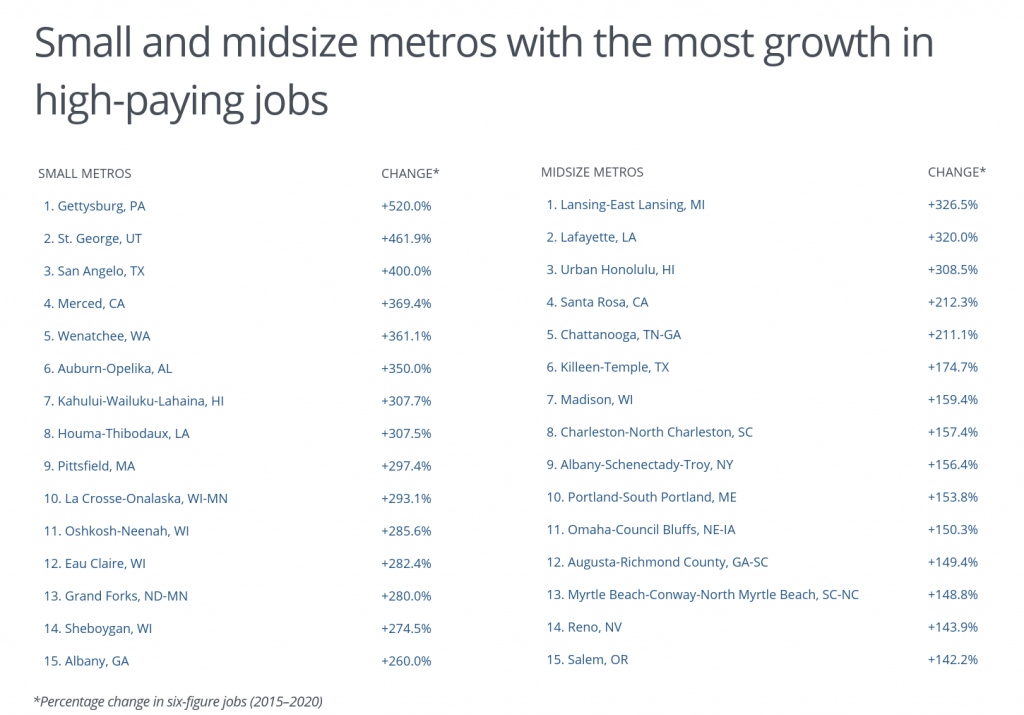
At the local level, low costs can also be a major draw for companies looking to grow or expand, along with access to a strong labor supply or top universities. These factors have boosted the growth of high-paying jobs in metros like Nashville, Phoenix, and others as they have emerged as viable alternatives to established centers like New York or the Bay Area.
To determine the locations with the largest growth in high-paying jobs, researchers at Stessa calculated the percentage change in employment in six-figure jobs from 2015 to 2020 using data from the U.S. Bureau of Labor Statistics. In the event of a tie, the location with the greater percentage of total employment in six-figure jobs for 2020 was ranked higher. For the purpose of this analysis, employment in six-figure jobs was defined as total employment in occupations with a median annual wage of $100,000 or more.
Here are the metros with the largest growth in high-paying jobs.
Large Metros With the Most Growth in High-Paying Jobs

Photo Credit: Sean Pavone / Shutterstock
15. Austin-Round Rock, TX
- Percentage change in six-figure jobs (2015–2020): +101.1%
- Percentage of total employment in six-figure jobs (2020): 7.6%
- Total employment in six-figure jobs (2020): 80,560
- Total employment in six-figure jobs (2015): 40,060
- Median annual wage across all occupations (2020): $44,020

Photo Credit: Sean Pavone / Shutterstock
14. Louisville/Jefferson County, KY-IN
- Percentage change in six-figure jobs (2015–2020): +105.0%
- Percentage of total employment in six-figure jobs (2020): 2.9%
- Total employment in six-figure jobs (2020): 17,590
- Total employment in six-figure jobs (2015): 8,580
- Median annual wage across all occupations (2020): $39,330

Photo Credit: Andrew Zarivny / Shutterstock
13. Sacramento–Roseville–Arden-Arcade, CA
- Percentage change in six-figure jobs (2015–2020): +107.7%
- Percentage of total employment in six-figure jobs (2020): 12.9%
- Total employment in six-figure jobs (2020): 124,480
- Total employment in six-figure jobs (2015): 59,930
- Median annual wage across all occupations (2020): $48,070

Photo Credit: Sean Pavone / Shutterstock
12. Raleigh, NC
- Percentage change in six-figure jobs (2015–2020): +109.2%
- Percentage of total employment in six-figure jobs (2020): 9.9%
- Total employment in six-figure jobs (2020): 61,470
- Total employment in six-figure jobs (2015): 29,380
- Median annual wage across all occupations (2020): $43,500
Photo Credit: Sean Pavone / Shutterstock
11. Salt Lake City, UT
- Percentage change in six-figure jobs (2015–2020): +122.3%
- Percentage of total employment in six-figure jobs (2020): 6.2%
- Total employment in six-figure jobs (2020): 45,090
- Total employment in six-figure jobs (2015): 20,280
- Median annual wage across all occupations (2020): $42,280

Photo Credit: Jon Bilous / Shutterstock
10. Portland-Vancouver-Hillsboro, OR-WA
- Percentage change in six-figure jobs (2015–2020): +124.7%
- Percentage of total employment in six-figure jobs (2020): 10.1%
- Total employment in six-figure jobs (2020): 115,080
- Total employment in six-figure jobs (2015): 51,220
- Median annual wage across all occupations (2020): $48,050

Photo Credit: Sergey Novikov / Shutterstock
9. Buffalo-Cheektowaga-Niagara Falls, NY
- Percentage change in six-figure jobs (2015–2020): +143.0%
- Percentage of total employment in six-figure jobs (2020): 5.0%
- Total employment in six-figure jobs (2020): 24,590
- Total employment in six-figure jobs (2015): 10,120
- Median annual wage across all occupations (2020): $42,040

Photo Credit: Sean Pavone / Shutterstock
8. Tucson, AZ
- Percentage change in six-figure jobs (2015–2020): +156.2%
- Percentage of total employment in six-figure jobs (2020): 3.7%
- Total employment in six-figure jobs (2020): 13,730
- Total employment in six-figure jobs (2015): 5,360
- Median annual wage across all occupations (2020): $38,900

Photo Credit: f11photo / Shutterstock
7. San Antonio-New Braunfels, TX
- Percentage change in six-figure jobs (2015–2020): +163.0%
- Percentage of total employment in six-figure jobs (2020): 5.7%
- Total employment in six-figure jobs (2020): 56,780
- Total employment in six-figure jobs (2015): 21,590
- Median annual wage across all occupations (2020): $37,920

Photo Credit: Henryk Sadura / Shutterstock
6. Grand Rapids-Wyoming, MI
- Percentage change in six-figure jobs (2015–2020): +175.2%
- Percentage of total employment in six-figure jobs (2020): 4.2%
- Total employment in six-figure jobs (2020): 21,630
- Total employment in six-figure jobs (2015): 7,860
- Median annual wage across all occupations (2020): $39,430

Photo Credit: Steve Minkler / Shutterstock
5. Riverside-San Bernardino-Ontario, CA
- Percentage change in six-figure jobs (2015–2020): +181.3%
- Percentage of total employment in six-figure jobs (2020): 6.3%
- Total employment in six-figure jobs (2020): 93,620
- Total employment in six-figure jobs (2015): 33,280
- Median annual wage across all occupations (2020): $39,630

Photo Credit: Sean Pavone / Shutterstock
4. New Orleans-Metairie, LA
- Percentage change in six-figure jobs (2015–2020): +204.8%
- Percentage of total employment in six-figure jobs (2020): 6.5%
- Total employment in six-figure jobs (2020): 33,310
- Total employment in six-figure jobs (2015): 10,930
- Median annual wage across all occupations (2020): $38,280

Photo Credit: Sean Pavone / Shutterstock
3. Las Vegas-Henderson-Paradise, NV
- Percentage change in six-figure jobs (2015–2020): +216.1%
- Percentage of total employment in six-figure jobs (2020): 4.8%
- Total employment in six-figure jobs (2020): 43,690
- Total employment in six-figure jobs (2015): 13,820
- Median annual wage across all occupations (2020): $37,690

Photo Credit: Sean Pavone / Shutterstock
2. Phoenix-Mesa-Scottsdale, AZ
- Percentage change in six-figure jobs (2015–2020): +217.1%
- Percentage of total employment in six-figure jobs (2020): 8.6%
- Total employment in six-figure jobs (2020): 180,740
- Total employment in six-figure jobs (2015): 57,000
- Median annual wage across all occupations (2020): $41,300

Photo Credit: Mihai_Andritoiu / Shutterstock
1. Nashville-Davidson–Murfreesboro–Franklin, TN
- Percentage change in six-figure jobs (2015–2020): +270.9%
- Percentage of total employment in six-figure jobs (2020): 5.6%
- Total employment in six-figure jobs (2020): 53,820
- Total employment in six-figure jobs (2015): 14,510
- Median annual wage across all occupations (2020): $40,650
Detailed Findings & Methodology
The data used in this analysis is from the U.S. Bureau of Labor Statistics Occupational Employment and Wage Statistics tables. To determine the locations with the largest growth in high-paying jobs, researchers calculated the percentage change in employment in six-figure jobs from 2015 to 2020, and checked for statistical significance. In the event of a tie, the location with the greater percentage of total employment in six-figure jobs for 2020 was ranked higher. For the purpose of this analysis, employment in six-figure jobs was defined as total employment in occupations with a median annual wage of $100,000 or more. To improve relevance, only metropolitan areas with at least 100,000 residents were included. Additionally, metros were grouped into cohorts based on population size: small (100,000–349,999), midsize (350,000–999,999), and large (1,000,000 or more).