


Photo Credit: Tero Vesalainen / Shutterstock
Earlier in November, President Joe Biden signed into law a $1.2 trillion infrastructure bill, one of the largest federal spending packages in history and a major component of Biden’s domestic agenda. The bipartisan bill includes billions of dollars in investment for infrastructure priorities like roads, bridges, and water and sewer systems. But one of the most significant items in the new bill is a $65 billion allocation to improve access and affordability for broadband internet.
Broadband advocates have been arguing for expanded access to high-speed internet for years. These advocates note that internet access is critical for participating in the modern economy but that many households and communities are unable to secure reliable internet service. In 2019, the Federal Communications Commission estimated that 21 million Americans lacked access to broadband internet, and others have placed the figure far higher than that. And even in communities where broadband is available, some lower-income households cannot afford the cost of service.
But the COVID-19 pandemic may have been the catalyst to push universal broadband forward as a policy priority. As millions of American households transitioned to working and schooling from home during the pandemic, a lack of reliable internet service left some workers unable to participate in the economy and deprived students of classroom instruction time.
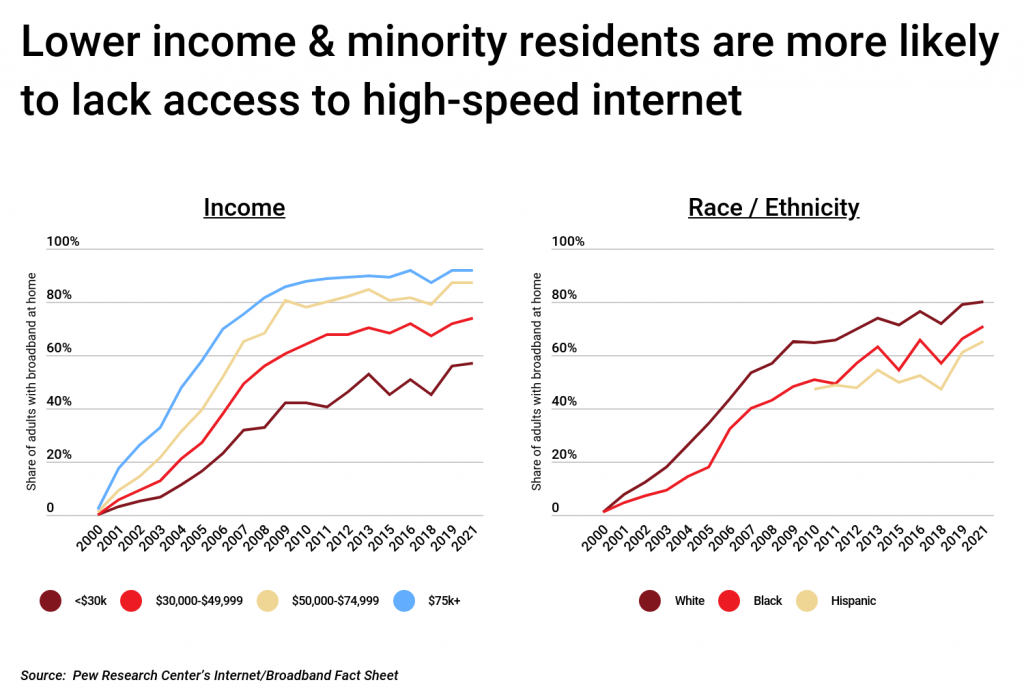
This lack of access has disproportionately affected some communities more than others. Broadband access is highly correlated to a variety of demographic and economic factors, particularly income and race. Data from the Pew Research Center shows that as of 2021, 92% of adults making greater than $75,000 per year had access to high-speed internet, compared to just 57% of those who earned less than $30,000 per year. Along the lines of race and ethnicity, 80% of white adults have reliable high-speed internet access, compared to just 71% of Black adults and 65% of Hispanic adults.
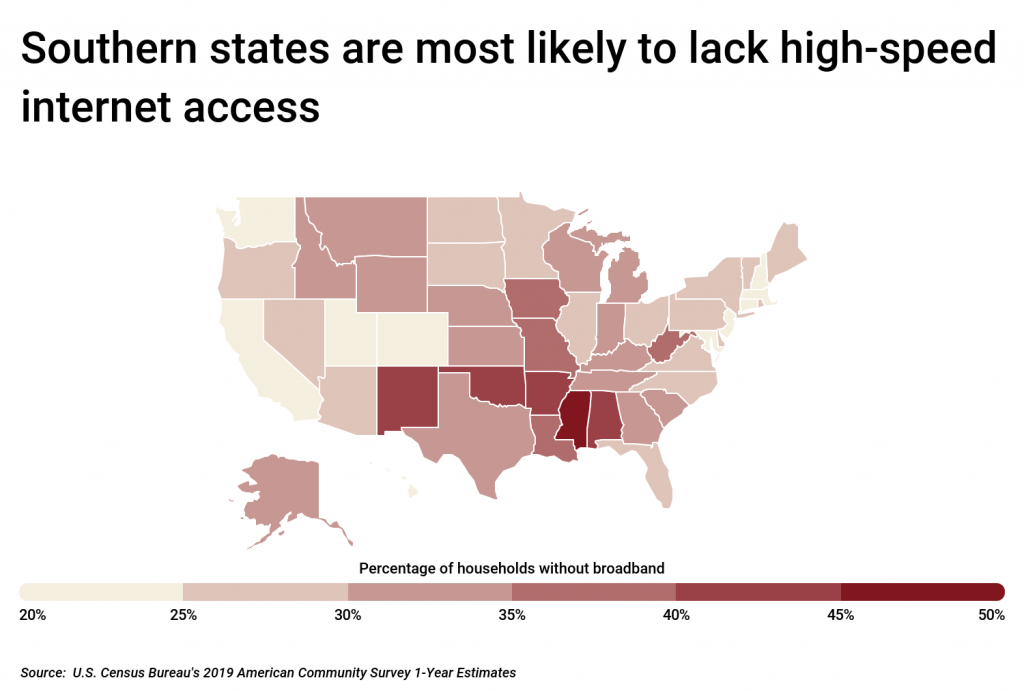
The demographic distribution of broadband access is also closely related to geography. Rural areas lag far behind urban and suburban communities in access to reliable high-speed internet. And rural areas with a higher population of racial and ethnic minorities and lower income levels—such as in southern states like Mississippi, Arkansas, and Alabama—are the locations most likely to lack high-speed internet access. At the metro level, many economically distressed communities in the South and the Rust Belt region are among the least likely to have high-speed internet available.
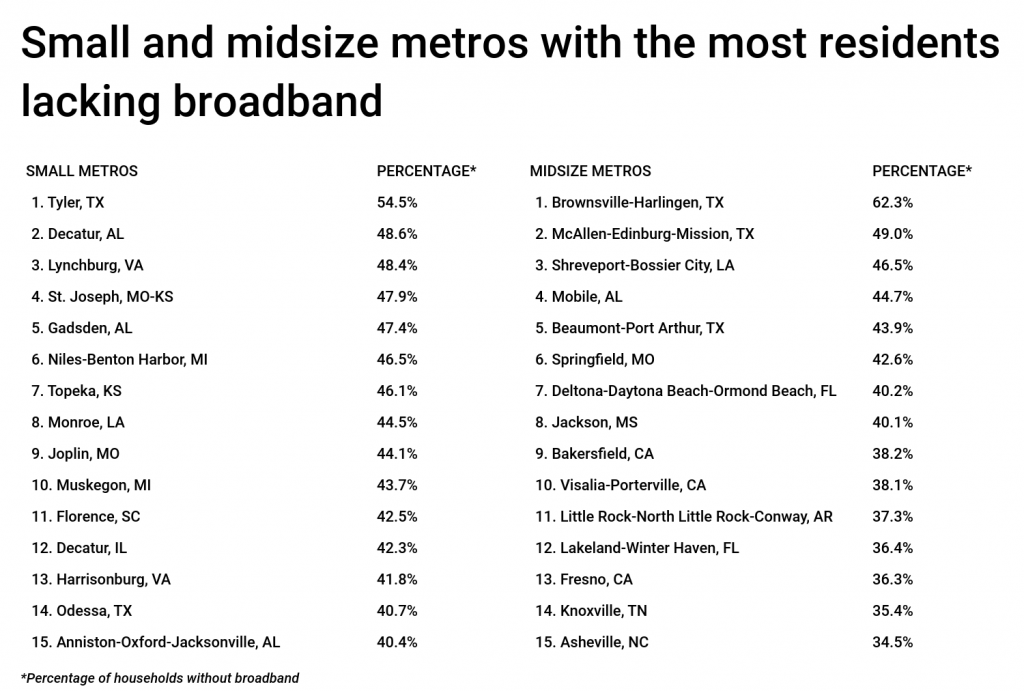
The data used in this study is from the U.S. Census Bureau’s 2019 American Community Survey. To identify the locations with the most residents lacking high-speed internet, researchers at KTCB calculated the share of households without access to broadband internet service such as cable, fiber optic, or DSL installed in the household. In the event of a tie, the location with the greater percentage of residents lacking any internet access was ranked above. Researchers also calculated the percentage of households whose only way to access the internet is through a cellular data plan, median household income, and the poverty rate.
Here are the metropolitan areas with the most residents lacking high-speed internet.
Large Metros With the Most Residents Lacking Broadband
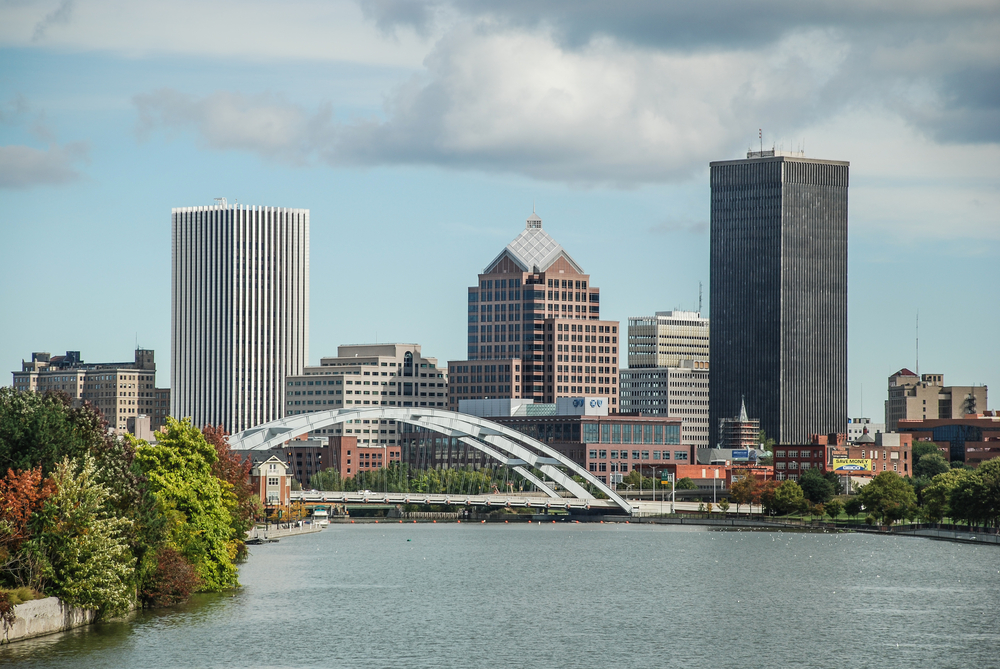
Photo Credit: TarnPisessith / Shutterstock
15. Rochester, NY
- Percentage of households without broadband: 28.0%
- Percentage of households without any internet access: 10.9%
- Percentage of households with cellular data only: 10.6%
- Median household income: $61,000
- Poverty rate: 12.4%

Photo Credit: Ramunas Bruzas / Shutterstock
14. Jacksonville, FL
- Percentage of households without broadband: 28.2%
- Percentage of households without any internet access: 7.7%
- Percentage of households with cellular data only: 13.8%
- Median household income: $64,800
- Poverty rate: 11.5%

Photo Credit: Sean Pavone / Shutterstock
13. Miami-Fort Lauderdale-West Palm Beach, FL
- Percentage of households without broadband: 28.3%
- Percentage of households without any internet access: 11.6%
- Percentage of households with cellular data only: 10.3%
- Median household income: $59,500
- Poverty rate: 13.5%

Photo Credit: f11photo / Shutterstock
12. St. Louis, MO-IL
- Percentage of households without broadband: 28.7%
- Percentage of households without any internet access: 10.3%
- Percentage of households with cellular data only: 11.0%
- Median household income: $65,000
- Poverty rate: 9.9%

Photo Credit: Felix Lipov / Shutterstock
11. Buffalo-Cheektowaga-Niagara Falls, NY
- Percentage of households without broadband: 28.7%
- Percentage of households without any internet access: 11.0%
- Percentage of households with cellular data only: 11.6%
- Median household income: $58,800
- Poverty rate: 13.1%

Photo Credit: Sean Pavone / Shutterstock
10. Indianapolis-Carmel-Anderson, IN
- Percentage of households without broadband: 29.0%
- Percentage of households without any internet access: 11.4%
- Percentage of households with cellular data only: 11.4%
- Median household income: $62,000
- Poverty rate: 10.5%

Photo Credit: Felix Mizioznikov / Shutterstock
9. Richmond, VA
- Percentage of households without broadband: 29.7%
- Percentage of households without any internet access: 12.9%
- Percentage of households with cellular data only: 10.8%
- Median household income: $67,800
- Poverty rate: 10.0%
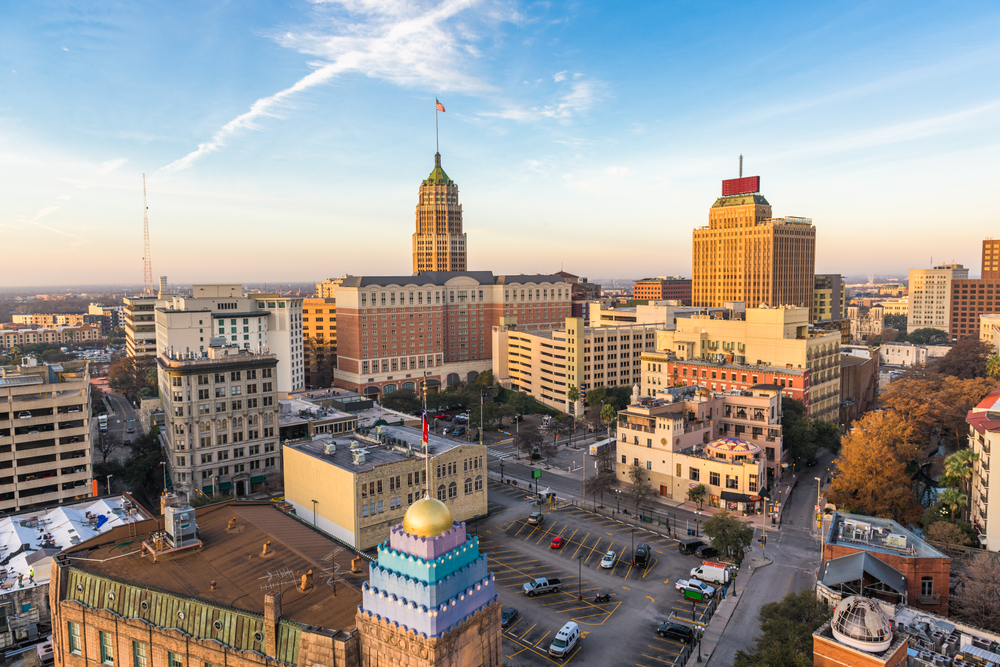
Photo Credit: Sean Pavone / Shutterstock
8. San Antonio-New Braunfels, TX
- Percentage of households without broadband: 29.8%
- Percentage of households without any internet access: 10.8%
- Percentage of households with cellular data only: 11.5%
- Median household income: $60,600
- Poverty rate: 13.5%
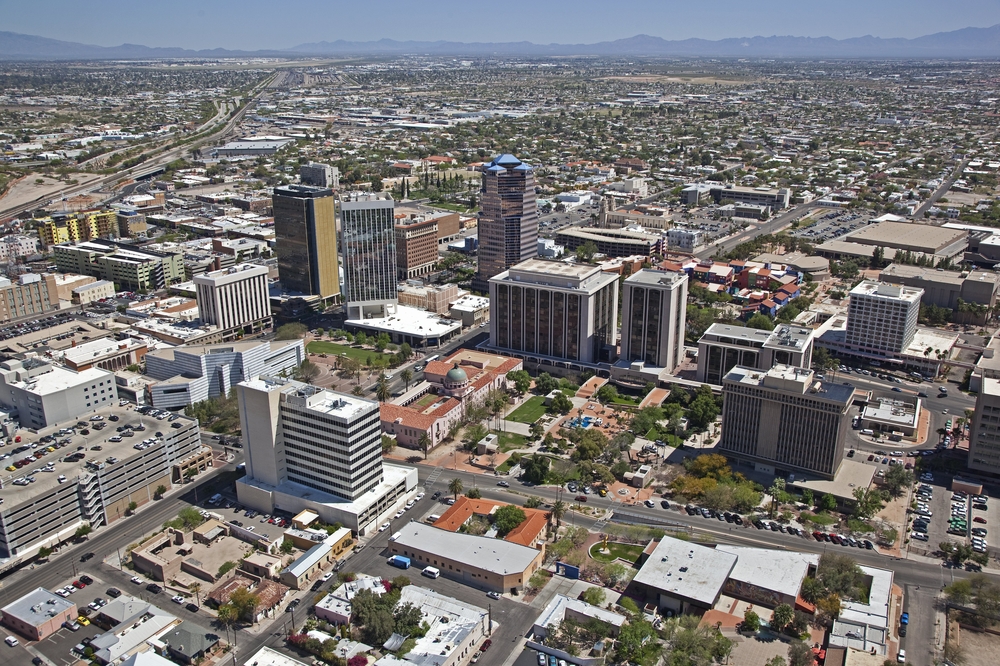
Photo Credit: Tim Roberts Photography / Shutterstock
7. Tucson, AZ
- Percentage of households without broadband: 30.5%
- Percentage of households without any internet access: 9.6%
- Percentage of households with cellular data only: 12.7%
- Median household income: $55,980
- Poverty rate: 13.8%

Photo Credit: Ekaterina Cratcha / Shutterstock
6. Cleveland-Elyria, OH
- Percentage of households without broadband: 30.6%
- Percentage of households without any internet access: 14.7%
- Percentage of households with cellular data only: 8.7%
- Median household income: $55,760
- Poverty rate: 13.5%

Photo Credit: evenfh / Shutterstock
5. New Orleans-Metairie, LA
- Percentage of households without broadband: 32.6%
- Percentage of households without any internet access: 14.0%
- Percentage of households with cellular data only: 12.1%
- Median household income: $55,000
- Poverty rate: 16.4%

Photo Credit: Jonny Trego / Shutterstock
4. Louisville/Jefferson County, KY-IN
- Percentage of households without broadband: 33.4%
- Percentage of households without any internet access: 12.7%
- Percentage of households with cellular data only: 14.6%
- Median household income: $60,400
- Poverty rate: 11.9%

Photo Credit: Sean Pavone / Shutterstock
3. Oklahoma City, OK
- Percentage of households without broadband: 34.3%
- Percentage of households without any internet access: 10.1%
- Percentage of households with cellular data only: 16.1%
- Median household income: $60,000
- Poverty rate: 13.1%

Photo Credit: The Speedy Butterfly / Shutterstock
2. Memphis, TN-MS-AR
- Percentage of households without broadband: 36.8%
- Percentage of households without any internet access: 16.9%
- Percentage of households with cellular data only: 11.4%
- Median household income: $54,500
- Poverty rate: 15.4%

Photo Credit: Sean Pavone / Shutterstock
1. Birmingham-Hoover, AL
- Percentage of households without broadband: 37.0%
- Percentage of households without any internet access: 12.5%
- Percentage of households with cellular data only: 16.4%
- Median household income: $57,100
- Poverty rate: 14.0%
Methodology & Detailed Findings
The data used in this study is from the U.S. Census Bureau’s 2019 American Community Survey 1-Year Estimates and Pew Research Center’s Internet/Broadband Fact Sheet. To identify the locations with the most residents lacking high-speed internet, researchers calculated the share of households without broadband internet service such as cable, fiber optic, or DSL installed in the household. In the event of a tie, the location with the greater percentage of residents lacking any internet access was ranked above. Researchers also calculated the percentage of households whose only way to access the internet is through a cellular data plan, median household income, and the poverty rate. For a detailed overview of the internet-related variables from Census, see this page. Only locations with at least 100,000 residents were included in the analysis. Additionally, locations were grouped based on population size: small (100,000–349,999), midsize (350,000–999,999), and large (1,000,000+).