


Photo Credit: ppa / Shutterstock
The COVID-19 pandemic created divergent fortunes for different parts of the income scale, and housing provides some of the starkest examples.
Low-income earners were more likely to lose their jobs or have hours cut back and as a result relied more on government stimulus measures like direct payments, expanded unemployment benefits, eviction moratoriums, and mortgage forbearance programs to keep their housing arrangements. Meanwhile, middle and upper income earners were able to benefit from low interest rates, strong savings and market returns, and increasingly flexible work policies to seek out new homes. These households’ interest in buying homes led to sky-high demand for residential real estate, with homes quickly being snapped up off the market for record prices.
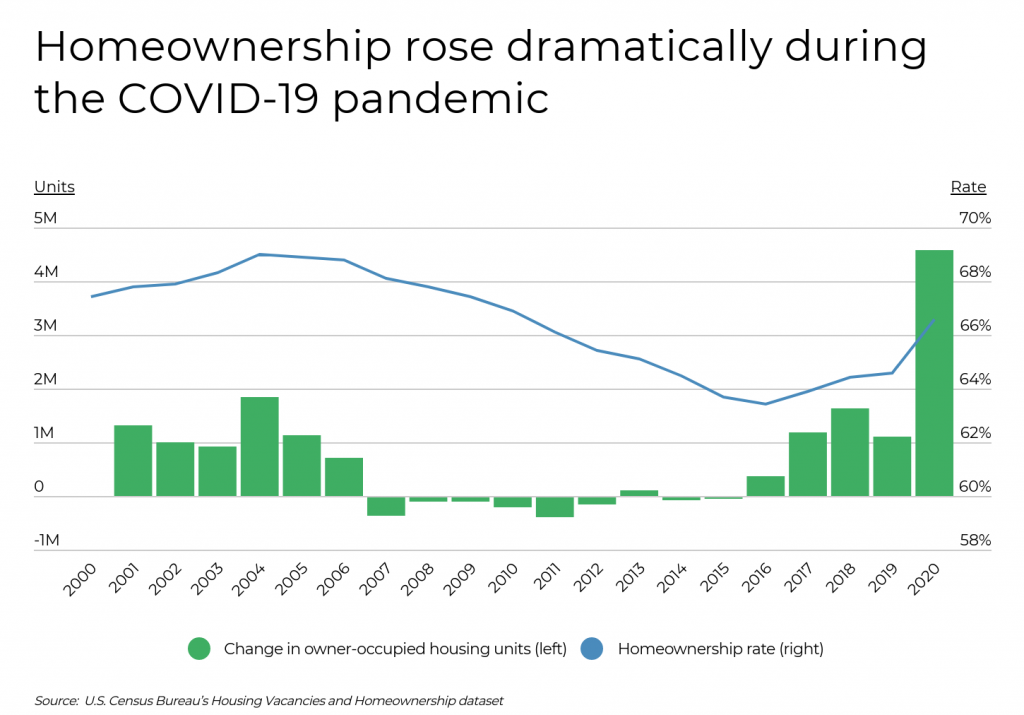
Recent data from the U.S. Census Bureau illustrates how rapidly homeownership has risen during the pandemic as a result of this demand. Homeownership began to decline after the collapse of the housing bubble and Great Recession and only began to recover after 2015. Since then, homeownership had slowly been trending upward but saw an especially sharp spike from 2019 to 2020. In that year, the homeownership rate rose two percentage points, from 64.6% to 66.6%, while the raw number of owner-occupied units rose by 4.6 million, to 83.8 million.
But while COVID-19 has clearly accelerated the demand for homes, the benefits of homeownership are not shared by all. Price increases as a result of a competitive market are putting homes out of reach for lower-earning households. These households are often found in demographic groups that have historically faced more challenges in achieving the goal of homeownership. In particular, younger Americans and racial and ethnic minorities own homes at lower rates than other parts of the population.
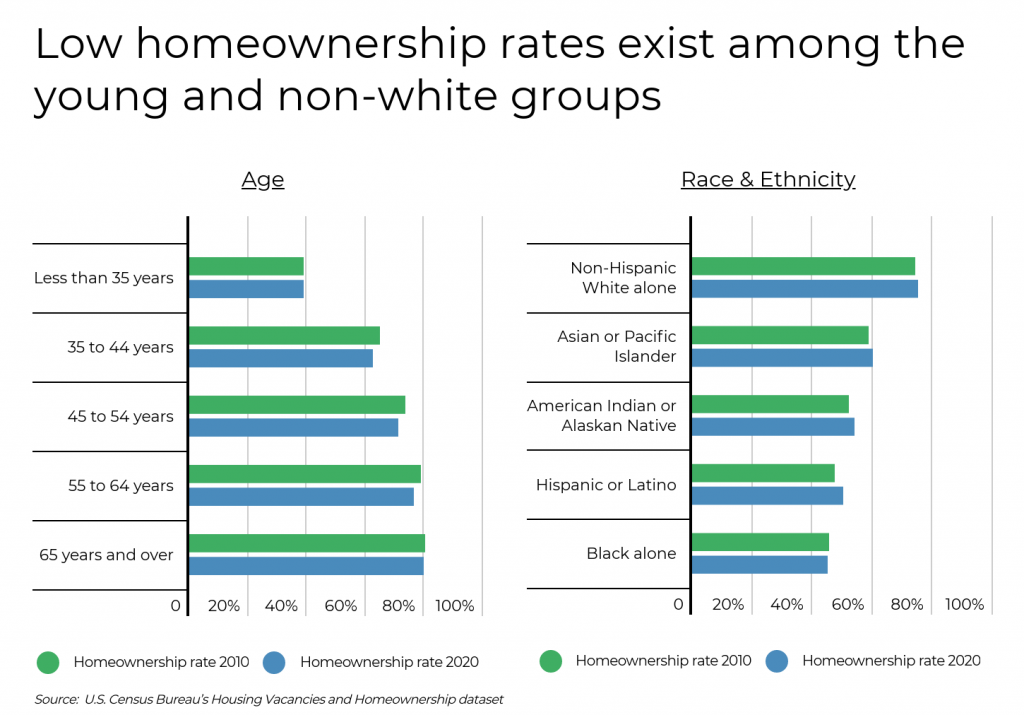
Millennials—currently aged 25 to 40—are poised to become a major force in the real estate market as the largest generation in the U.S., but homeownership rates among younger groups remain below the rates for older cohorts. Only around 40% of those under 35 owned a home in 2020, while 62.7% of adults aged 35 to 44 owned a home. Every other age group has homeownership rates of more than 70%.
Homeownership rates also demonstrate disparities based on race and ethnicity. The homeownership rate for non-Hispanic whites is 75%, which easily outstrips the rate for Asian Americans (60.3%), American Indians (54.2%), Hispanics or Latinos (50.1%), and Black Americans (45.3%). And while rates for some racial and ethnic minorities have grown in recent years, there was actually a slight decline in Black homeownership from 2010 to 2020.
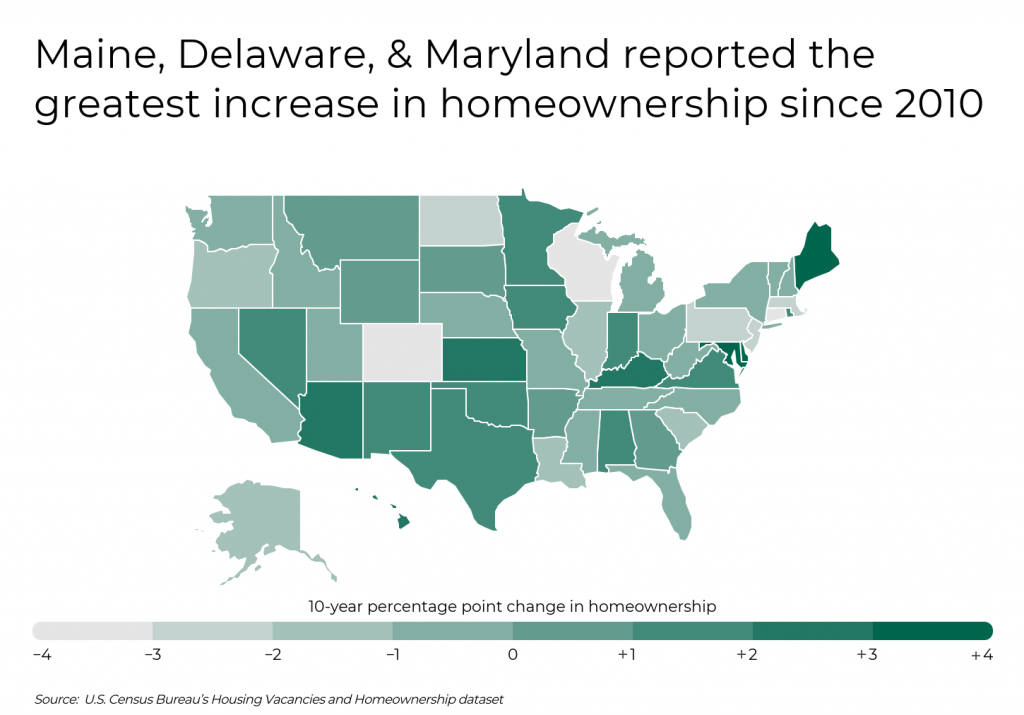
Changes in homeownership rates are also variable based on geography. This is in part related to an area’s demographic makeup, but economic factors like income levels, housing values, and supply in each market. Between 2010 and 2020, a total of 22 states saw an increase in homeownership rates, led by Maine, Delaware, and Maryland, which each saw increases above 3 percentage points. Among states that saw a decline in homeownership rates, Connecticut led with a drop of 3.9 percentage points over the last decade.
To determine the metropolitan areas with the largest increase in homeownership over the past ten years, researchers at Filterbuy calculated the percentage point change in the homeownership rate between 2010 and 2020 using data from the Census Bureau. Researchers also included home price data from Zillow. Only the 70 largest U.S. metropolitan areas with available data from Census were considered in the analysis.
Here are the metros with the largest increase in homeownership over the past decade.
Metros With the Largest Increase in Homeownership

Photo Credit: Agnieszka Gaul / Shutterstock
15. Columbus, OH
- 10-year percentage point change in homeownership: +3.4
- Homeownership rate (2020): 65.6%
- Homeownership rate (2010): 62.2%
- Median home price: $261,324

Photo Credit: Richard Cavalleri / Shutterstock
14. Providence-Warwick, RI-MA
- 10-year percentage point change in homeownership: +3.8
- Homeownership rate (2020): 64.8%
- Homeownership rate (2010): 61.0%
- Median home price: $403,984

Photo Credit: Sean Pavone / Shutterstock
13. Houston-The Woodlands-Sugar Land, TX
- 10-year percentage point change in homeownership: +3.9
- Homeownership rate (2020): 65.3%
- Homeownership rate (2010): 61.4%
- Median home price: $263,096

Photo Credit: Bonnie Fink / Shutterstock
12. Tampa-St Petersburg-Clearwater, FL
- 10-year percentage point change in homeownership: +3.9
- Homeownership rate (2020): 72.2%
- Homeownership rate (2010): 68.3%
- Median home price: $303,374
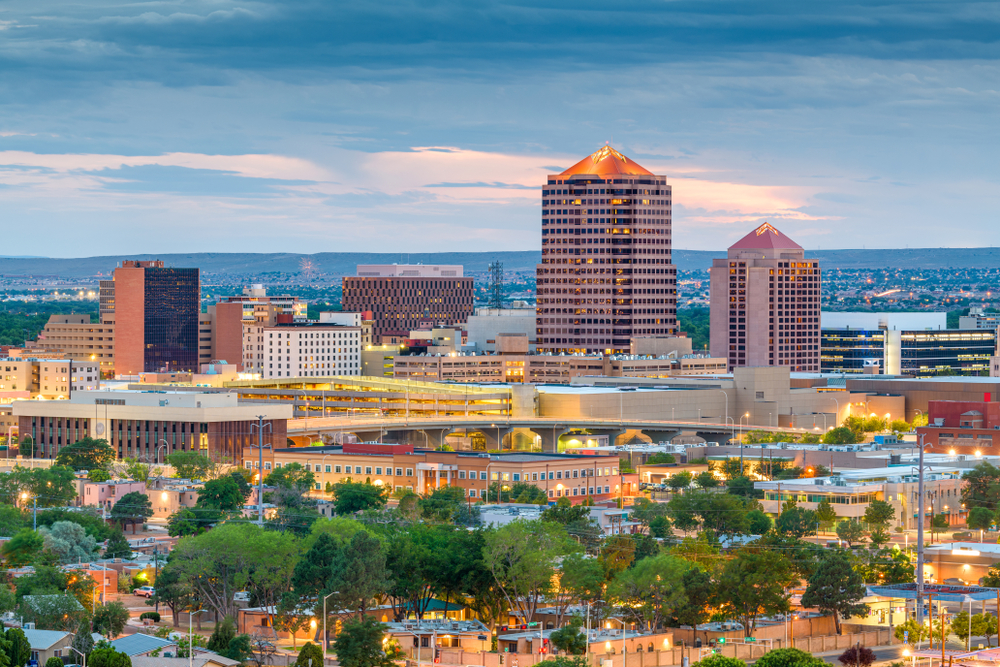
Photo Credit: Sean Pavone / Shutterstock
11. Albuquerque, NM
- 10-year percentage point change in homeownership: +4.0
- Homeownership rate (2020): 69.5%
- Homeownership rate (2010): 65.5%
- Median home price: $270,176

Photo Credit: Patricia Elaine Thomas / Shutterstock
10. Dayton, OH
- 10-year percentage point change in homeownership: +4.0
- Homeownership rate (2020): 71.4%
- Homeownership rate (2010): 67.4%
- Median home price: $170,523

Photo Credit: Jon Bilous / Shutterstock
9. Virginia Beach-Norfolk-Newport News, VA-NC
- 10-year percentage point change in homeownership: +4.4
- Homeownership rate (2020): 65.8%
- Homeownership rate (2010): 61.4%
- Median home price: $288,446

Photo Credit: Sean Pavone / Shutterstock
8. Baltimore-Columbia-Towson, MD
- 10-year percentage point change in homeownership: +5.0
- Homeownership rate (2020): 70.7%
- Homeownership rate (2010): 65.7%
- Median home price: $347,014
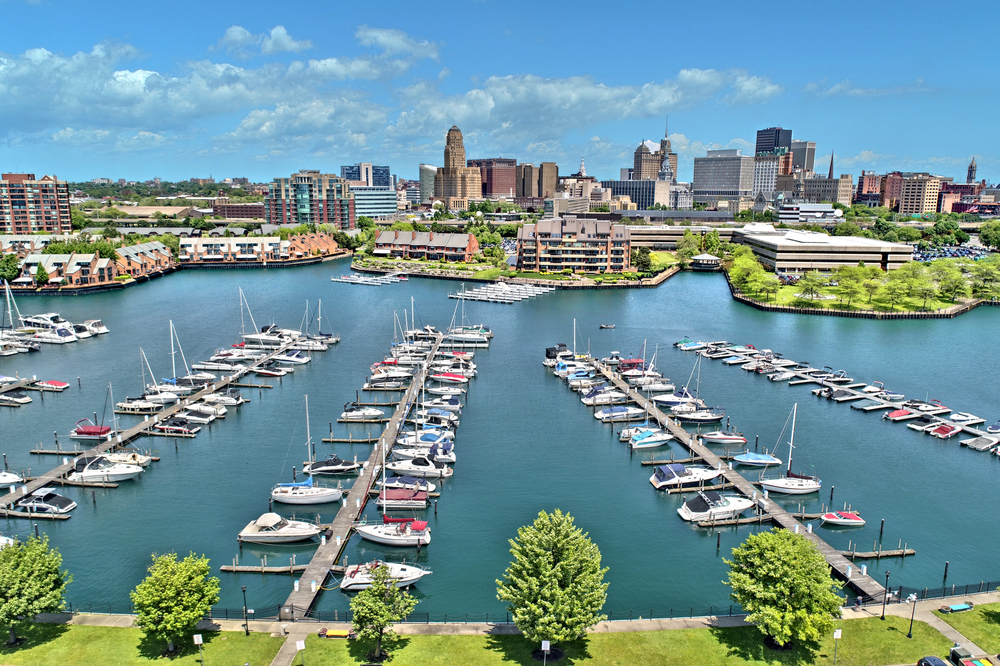
Photo Credit: Open.Tours LLC / Shutterstock
7. Buffalo-Cheektowaga-Niagara Falls, NY
- 10-year percentage point change in homeownership: +5.6
- Homeownership rate (2020): 70.1%
- Homeownership rate (2010): 64.5%
- Median home price: $225,638

Photo Credit: Sean Pavone / Shutterstock
6. Louisville/Jefferson County, KY-IN
- 10-year percentage point change in homeownership: +5.9
- Homeownership rate (2020): 69.3%
- Homeownership rate (2010): 63.4%
- Median home price: $215,947

Photo Credit: Sean Pavone / Shutterstock
5. Tulsa, OK
- 10-year percentage point change in homeownership: +5.9
- Homeownership rate (2020): 70.1%
- Homeownership rate (2010): 64.2%
- Median home price: $179,284

Photo Credit: Jon Bilous / Shutterstock
4. Charlotte-Concord-Gastonia, NC-SC
- 10-year percentage point change in homeownership: +7.2
- Homeownership rate (2020): 73.3%
- Homeownership rate (2010): 66.1%
- Median home price: $311,157

Photo Credit: stellamc / Shutterstock
3. Fresno, CA
- 10-year percentage point change in homeownership: +7.8
- Homeownership rate (2020): 57.1%
- Homeownership rate (2010): 49.3%
- Median home price: $344,130

Photo Credit: Rosamar / Shutterstock
2. Cincinnati, OH-KY-IN
- 10-year percentage point change in homeownership: +8.3
- Homeownership rate (2020): 71.1%
- Homeownership rate (2010): 62.8%
- Median home price: $232,065

Photo Credit: Wirestock Creators / Shutterstock
1. Syracuse, NY
- 10-year percentage point change in homeownership: +10.3
- Homeownership rate (2020): 71.4%
- Homeownership rate (2010): 61.1%
- Median home price: $177,464
Detailed Findings & Methodology
The data used in this analysis is from the U.S. Census Bureau’s Housing Vacancies and Homeownership tables and Zillow’s Housing Data. To determine the locations with the largest increase in homeownership over the past ten years, researchers calculated the percentage point change in the homeownership rate between 2010 and 2020. In the event of a tie, the location with the higher homeownership rate for 2020 was ranked higher. Only the 70 largest U.S. metropolitan areas with available data were considered in the analysis.